
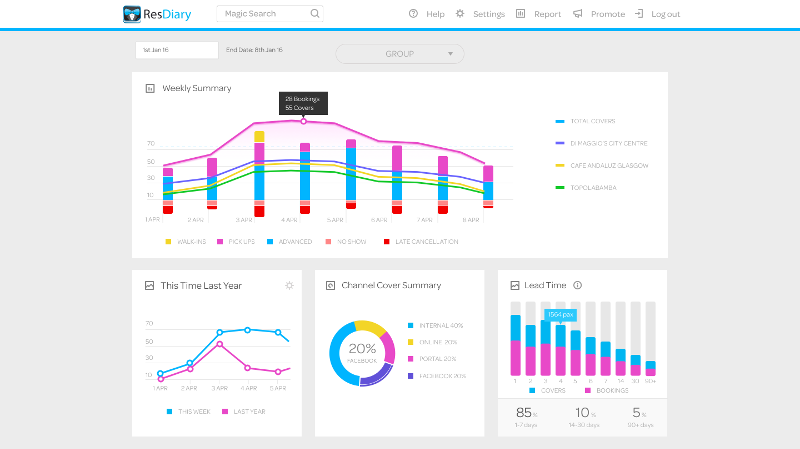
The ResDiary Dashboard gives restaurant managers a quick and instant view of their business KPIs in charts. TheWeekly Summary let’s you view site performance on a day by day basis or why not benchmark your progress year on year with the This Time Last Year summary. Discover where your bookings are coming from and the cost of customer acquisition with the Channel Summary. The Lead Time Summary allows you to see advance bookings and will give you an indication of the success of marketing campaigns. The ResDiary Dashboard is designed for both single site managers and multiple operators, allowing users to easily assess and respond to the needs of their business.
Business Benefits
The Weekly Summary let’s you view performance on a day by day basis across a single week.- compare walk ins vs. no shows to see if your team are compensating for no shows
- compare pick ups (bookings made on the dining date) with late cancellations (bookings cancelled on the dining date) to see if your team are managing your standby list correctly.
The Channel Summary provides valuable insight where your bookings are coming from.
The Lead Time Summary enables a visualization of the time in advance that bookings are made
How the ResDiary Dashboard Works
The ResDiary Dashboard is enabled on a user by user basis at Settings> Security> Groups so that they have access to the booking statistics of the sites that they have access to. For example:Where there are 3 sites in a group then- User 1 who has access to a single venue will be able to view the dashboard for that venue alone.
- User 2 who has access to 2 out of 3 will be able to view a group dashboard displaying the statistics of the 2 venues plus the individual dashboard for each venue.
- User 3 who has access to all 3 will be able to view a group dashboard displaying the statistics of the 3 venues plus the individual dashboard for each venue.
.png)